


Taikymo informacija:
Versija: 1.0 Atnaujintas
Įkėlimo datą: 6 Oct 11
Licencija: Nemokamai
Populiarumas: 44
Dydis: 4 Kb
Investar Mobile for NSE BSE
& Nbsp;
.bullet
{
padding: 0px 0px 0px 20px; line-height: normal; margin-top: 5px; margin-dešinę: 0pt; margin-bottom: 0pt; margin-left: 10px; background-image: url (images / icon1.jpg); background-pozicija: kairė 3PX; background-pakartokite: ne-pakartojimas;
}
Shows Interactive Candlestick & Line chart (six month daily view) along with Indicators like EMA, SMA, RSI, Stochastics, MACD and Volume.
Splits, Dividends and Bonuses displayed in the Charts.
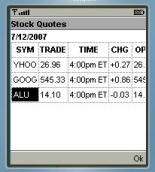
Shows OHLC values
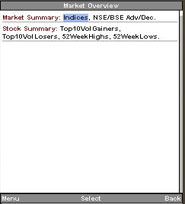
Shows Pivot Lines and Resistance & Support Levels.
Allows users to Add Notes.
Panašūs pieteikumi

7 Ways to Avoid Credit Card Fraud
21 Oct 12

Accountancy Age
16 Mar 11
J2MEStock
10 Feb 11

iBuyWeSell (Java)
13 Jun 12
Komentarai Investar Mobile for NSE BSE
Paieška pagal prietaiso

Populiarus Applicazioni

Angry Birds News on biNu 20 May 11

Skype Lite (Nokia) 9 Mar 11

Award Winning Translator 9 Aug 11

UC Browser Official Indonesian 22 Dec 10

Mail.Ru Agent (Java) 31 Jan 17

Art Of War 2 10 Feb 17

uc browser 2013 5 Mar 13
Komentarai nerastas